Weekly Market Update
Get Insights Into The Latest Market News On A Weekly Basis
Market Update 4/24/23
By Will Hubbard
The major U.S. stock indexes were mostly down last week. The S&P 500 Index decreased by 0.10%, the Dow Jones Industrial Average lost 0.23%, the NASDAQ Composite dipped 0.42%, and the Russell 2000 small-capitalization index added 0.58%. The 10-year Treasury bond yield moved up 6 basis points to 3.57%. Spot gold closed the week at $1,983.06, down 1.05%.
Stocks
Equity markets experienced a lot of movement but made no real headway last week—despite the release of influential economic data, including housing starts, existing sales, unemployment numbers, and flash PMI.
Though the cost of mortgages is going up due to higher interest rates, housing remains relatively resilient. Last week’s housing starts were 1.42 million, slightly above the 1.4 million forecast. Existing home sales came in at 4.44 million, lower than the consensus of 4.5 million. Economists cite a housing shortage as the reason for continued upward pressure on housing prices.
The downside of home prices and mortgage costs staying high is that homebuyers will have to spend a higher percentage of their income on housing costs, reducing their disposable income to spend elsewhere in the economy. However, there is a real and psychological benefit to higher home prices. The source of the majority of most Americans’ wealth is their home. If they believe the value of that source of wealth is going up, they may be more likely to increase spending on other goods and services.
Unemployment claims are still very low. Last week’s claims came in at 245,000, higher than the expected 240,000. The U-3 and U-6 unemployment data from the U.S. Bureau of Labor Statistics remains strong, suggesting the 5,000 initial claims are immaterial at this point in the cycle. U-3 unemployment—the number of unemployed actively seeking work, also known as the official unemployment rate—was 3.8% in March 2022 and 3.6% in March 2023. U-6 unemployment includes those who are unemployed or marginally attached to the labor force, as well as part-time workers. That figure, which is always higher than the U-3 number because of its breadth, was 7.1% in March 2022 and 6.8% in March 2023. Both metrics for unemployment are historically low, suggesting the workforce has more disposable income, which could lead to more spending.
Spending money is dependent on jobs. Thankfully, the purchasing managers’ index (PMI) surprised to the upside on Friday (April 21). Values below 50.0 indicate industry contraction, while values above 50.0 indicate industry expansion. Friday’s flash manufacturing PMI came in at 50.4, higher than the expected 49.0. Services PMI, which has been hot for a while, came in at 53.7 versus the anticipated 51.5.
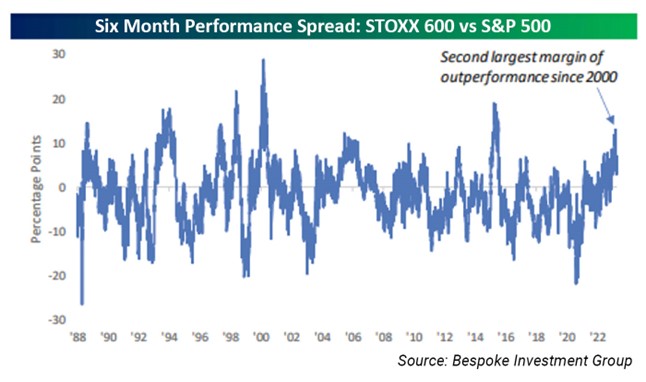
In equities, global investing continues to show promise. According to Bespoke Investment Group, the current margin of relative trailing 12-month performance between European and U.S. stocks is at the widest point since 2000.

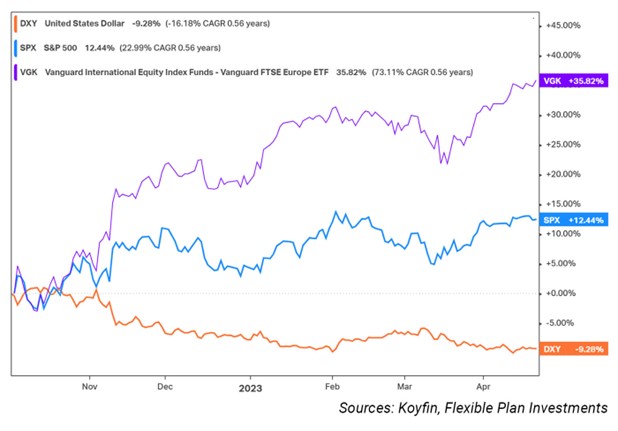
The outperformance picked up near the October lows. The following chart shows the STOXX 600 (purple line), as represented by Vanguard’s European Equity ETF, rebounded more sharply than the S&P 500 (blue line). This occurred coincidentally with the decline in the U.S. dollar (orange line) from its October peak.

The performance of the U.S. dollar can have long-term implications for the performance of U.S. equities. Should the formation of a trend continue, it is important to consider non-U.S. equity alternatives. U.S. investors have become extraordinarily complacent in their investing habits, overweighting U.S. equities over the last decade. That has been extraordinarily helpful to portfolio results looking back, but we need to be mindful of what potential exists in the future and prepare.
Bonds
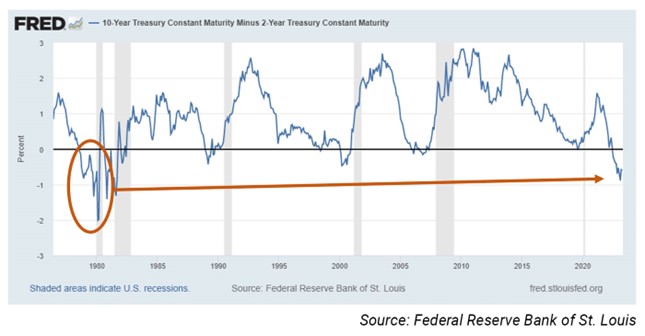
Bond yields are on the rise again. The 10-year yield went up 6 basis points from 3.51% to 3.57%. The yield curve flattened some in early March but remains the steepest it’s been since the mid-1980s. Before 1982, the previous large inversion started in the summer of 1978, and the spread eventually made its way to almost -2.5% in March 1980.
In that case, there were about 1.5 years between initial inversion to the start of an official recession. Even then, the six-month recession from January 1980 to July 1980 was not called a recession until June 3, 1980. If history rhymes, it could be two years from the day of the current inversion until a recession is officially called by the National Bureau of Economic Research (NBER)—if we’re going to experience one at all. The current two-year/10-year yield-curve inversion started in July 2022. If we followed the 1980 recession path perfectly, the official recession would start around January 2024, with NBER calling it in June of that year.

Gold
After dipping 1.05% last week, gold is sitting just off all-time highs a year after the inflation story unfolded and the U.S. dollar rose to new heights. Now, with the U.S. dollar under pressure and new price levels seeming more permanent, gold has finally agreed with the overall price levels. But gold doesn’t always behave as expected.
Gold bugs struggle with this reality. Some believe owning it helps mitigate stock volatility, while others believe it can act as an inflation hedge. Both can be true under certain circumstances. There is plenty of research that when markets become volatile, gold offers an uncorrelated asset, which is desirable to an investor seeking diversification. However, rising inflation rarely correlates to rising gold prices. Why is that?
The article “Inflation in the United States” by John Steele Gordon articulates the value of gold as an inflation hedge very well. It says, “Money is just another commodity, no different from petroleum, pork bellies, or pig iron. So money, like all commodities, can rise and fall in price, depending on supply and demand. But because money is, by definition, the one commodity that is universally accepted in exchange for every other commodity, we have a special term for a fall in the price of money: we call it inflation. As the price of money falls, the price of every other commodity must go up.”
Because gold and other commodities are limited in supply, if we increase the supply of currency, we will undoubtedly experience inflation. Gold and other commodities then revalue to reflect that increase.
Flexible Plan Investments (FPI) is the subadviser to the only U.S. gold mutual fund, The Gold Bullion Strategy Fund (QGLDX), designed at its introduction nine years ago to track the daily price changes in the precious metal.
The Indicators
The very short-term oriented QFC S&P Pattern Recognition strategy was 70% long throughout the week. Our QFC Political Seasonality Index was positioned in its 100% equity, risk-on mode last week. (Our QFC Political Seasonality Index is available—with all of the daily signals—post-login in our Weekly Performance Report section under the Domestic Tactical Equity category.)
Our intermediate-term tactical strategies have been varied in their degree of defensive positioning. The key advantages these strategies offer to investors are their ability to adapt to changing market environments, participate during uptrends, and adjust exposure to more defensive posturing during downtrends.
The Volatility Adjusted NASDAQ (VAN) strategy started the week 60% long. It moved to 80% long on Tuesday’s close and 100% long on Friday. The Systematic Advantage (SA) strategy started the week 90% long and cut exposure to 30% long on Monday’s close. The strategy then edged up to 60% long on Tuesday’s close before cutting exposure on Wednesday’s close to 30%. On Friday, the system moved to a 100% money-market position. Our QFC Self-adjusting Trend Following (QSTF) strategy was 200% all week. VAN, SA, and QSTF can all employ leverage—hence the investment positions may at times be more than 100%.
Our Classic model was long risk-on positioning all week. Most of our Classic accounts follow a signal that will allow the strategy to change exposure in as little as a week. A few accounts are on more restrictive platforms and can take up to one month to generate a new signal.
FPI’s Growth and Inflation measure, one of our Market Regime Indicators, shows markets are in a Normal economic environment stage (meaning inflation is rising and GDP is growing). This environment is the most common—accounting for 60% of the investable days since 2003—and favors stocks and gold. On average, gold has performed best during Normal market environments, but it comes with additional drawdown risk.
The S&P volatility regime is registering a Low and Falling reading, which favors equities over gold and then bonds from an annualized return standpoint. The combination has occurred 37% of the time since 2003. It is a stage associated with higher returns and less volatility from equities and bonds.
Previous Market Update Entries
Market Update: First-quarter 2023 recap
By Jason Teed The first quarter of 2023 saw mixed performance across equities, bonds, and gold. The S&P 500 increased by 7.5%, marking its best first-quarter performance since 2019 and the second best in the past decade. This robust growth came as a surprise...
Market Update 4/3/23
By Jason Teed The major U.S. stock market indexes were up last week. The Russell 2000 small-capitalization index rose 3.89%, the S&P 500 was up 3.48%, the NASDAQ Composite gained 3.37%, and the Dow Jones Industrial Average increased by 3.22%. All 11 market sectors...
Market Update 3/27/23
By Will Hubbard The major U.S. stock indexes were up last week despite some volatility. The S&P 500 Index finished up 1.39%, the Dow Jones Industrial Average gained 1.18%, the NASDAQ Composite rose an impressive 1.66%, and the Russell 2000 small-capitalization...
Subscribe to our newsletter
A digest of our latest news, articles and resources
Schedule A Call
We provide financial guidance by building real-world relationships.
It starts with a conversation, so let’s talk.
